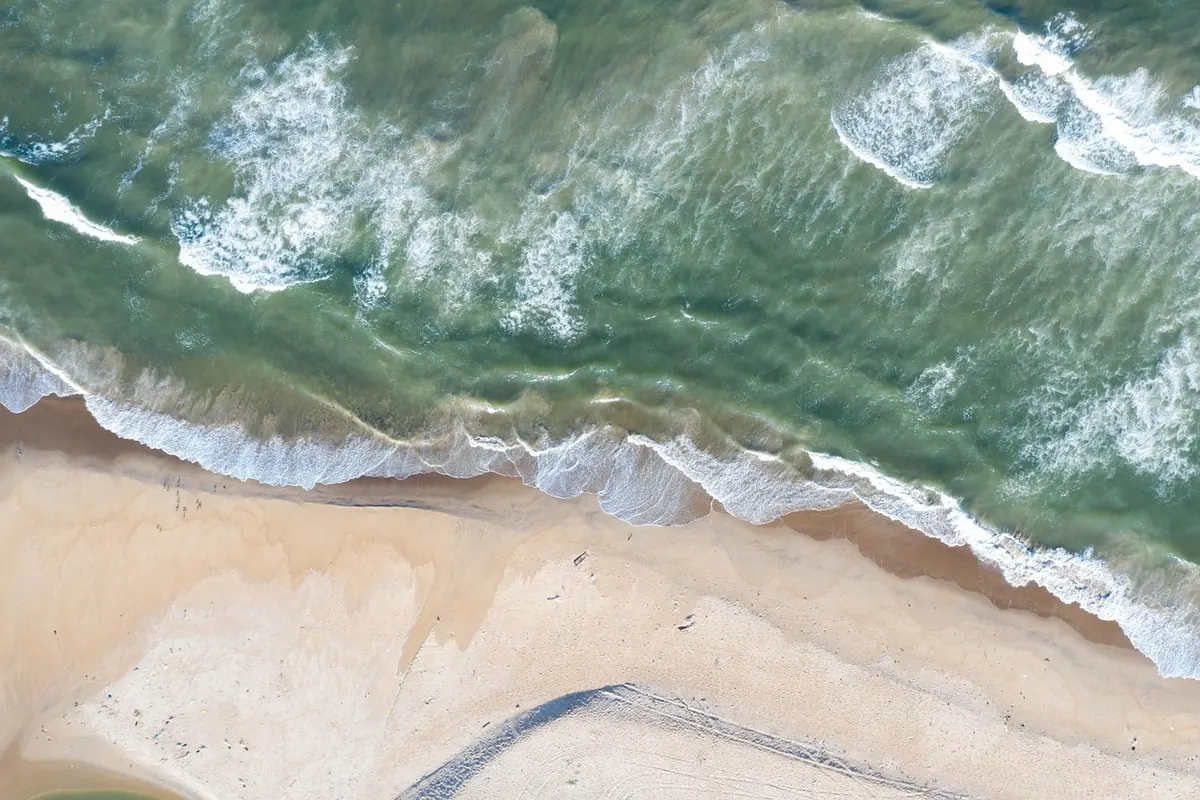
On a February morning after a westerly gale, the dune front looks different: a scalloped notch where there was a continuous slope, fresh sand thrown into the slack behind. The question that follows is always the same. How much moved, and from where? A line of GPS points tells you what happened along one transect. A drone survey, flown properly and repeated, tells you what happened across the whole foredune — including the blowout quietly forming a hundred metres along the beach.
The flying is the easy part. What decides whether your numbers survive scrutiny happens before take-off and long after landing: choosing the right resolution, fixing the survey to the ground, processing consistently, and being honest about how much change you can actually detect.
Start with the question, not the kit
Are you measuring sand lost from the dune toe, tracking a single blowout, or monitoring recovery after a storm season? Each answer points to a different survey design. A toe-erosion study needs a strip that runs from the upper beach into the first ridge, flown at fine resolution. A whole-system study needs a wider block, and can afford coarser detail.
For most foredunes, a ground sample distance of two to five centimetres is generous. At that scale an orthomosaic shows the erosion scarp, the strandline, embryo dunes and the vegetation edge clearly enough to map by eye as well as by algorithm. Going finer costs flight time and processing hours for detail the sand surface does not really hold.
One survey is a snapshot. Change needs at least two epochs, flown the same way. A pair taken before and after a winter is far more useful than six flights with drifting methods.
Plan the flight before you leave the office
Most failed surveys were lost on paper, not in the air. Walk through the following before you charge a battery.
- Permission and consent. Landowner agreement, plus any consent required for a protected site. Dune systems are often SSSIs or ASSIs, and nesting birds are legally protected. Check with the Civil Aviation Authority on operating rules and with the relevant statutory conservation body.
- Site constraints. Tide times, public access, livestock, and the parts of the site you must avoid during the breeding season.
- Weather and light. Wind low enough for a stable hover, no rain, and either even cloud or a reasonably high sun. Long shadows hide the surface and confuse image matching.
- Boundary and altitude. Fix a survey polygon that overlaps your previous and future flights, and record the altitude you fly at.
- Reference markers. Decide where your ground control will sit, and check that the points are reachable and visible from the air.
Ground control decides your accuracy
Photogrammetry drifts. Without something fixed to reality, each model can be tilted or shifted slightly, and a small shift looks exactly like erosion when you subtract one surface from another.
Ground control points — printed targets laid on the sand, their coordinates measured with a survey-grade GNSS receiver — anchor the model to real-world coordinates. If your aircraft or base station supports RTK or PPK positioning, you can work with fewer targets, but keep a handful of independent checkpoints that take no part in the alignment. Those checkpoints give you an honest error figure at the end.
For repeat work, establish permanent markers: a steel pin, a painted mark on a rock, a small concrete block. Sand moves constantly, so a reusable framework saves you from re-establishing control every season.
Flying for imagery that processes cleanly
Overlap is the first thing to get right. Around 75 per cent forward overlap and 60 to 70 per cent side overlap is a sensible starting point for dune terrain. Consistency matters more than precision: the same overlap each time means differences in your models come from the ground, not the flight.
Fly a proper grid at a fixed altitude over the same boundary on every visit. Keep the main block at nadir, then add a few oblique passes to capture steep slipfaces and the vertical face of an erosion scarp, which reproject poorly from straight-down images alone.
Use a fast shutter and low ISO, set exposure manually so it does not shift between frames, and slow the aircraft enough to avoid motion blur. Wet sand glinting in the sun and standing water in the slacks are genuinely difficult for photogrammetry — shoot on a duller day or accept gaps there. Keep lighting conditions similar between epochs. A model flown at noon in June will not compare neatly with one flown at four o'clock in December.
From photographs to a surface
Structure-from-motion software turns the image set into a point cloud, an orthomosaic and a digital surface model. Check three things before you trust it: the reprojection error, the density of tie points across the site, and the root-mean-square error at your checkpoints. That last number is your error budget, and it belongs in every write-up.
Vegetation is the quiet complication. A digital surface model traces whatever the camera sees, so dense marram grass lifts the surface above the sand. On bare sand at the dune toe this hardly matters. In a vegetated slack it matters a great deal. Either mask vegetation out of your difference maps or be explicit that you are measuring a canopy surface, not the ground beneath it.
Reading the change without fooling yourself
Subtract one surface from another and you have a DEM of difference. Raw, it is noisy. Set a level of detection from your checkpoint error — roughly, change smaller than that is indistinguishable from survey noise — and treat anything below it as no change at all.
Then read pattern rather than headline figures. Some familiar shapes are worth knowing:
- Erosion at the toe, deposition in the slack behind. Classic storm response, with sand moved inland rather than lost.
- Scarp retreat with little net volume change. Redistribution along the profile, not a loss from the system.
- Widespread lowering across bare sand after a dry, windy spell. Deflation, often with deposition downwind.
- Apparent change along a stable feature. Check it against a fixed object in the scene; if the object moved too, your alignment is at fault.
Quote volumes with an uncertainty range, not as single numbers. "Between this and that, allowing for survey error" is a stronger statement than a precise figure nobody can defend.
Build a routine you can repeat
Pick a season and a tide state and stick to them. Fly the same boundary at the same altitude with the same overlap, process with the same settings, and keep a plain field log: wind direction, recent weather, anything unusual on the day. That note often explains a puzzling result months later. Archive the raw imagery and the project files, not just the finished maps.
If the survey supports a planning application, a legal matter or a site management plan, get consent and take professional advice before flying. Rules on drone operations, protected sites and wildlife disturbance change, and a survey that ignores them can be worthless — or unlawful.
Photo: socialsudo / Pixabay